TM5
global chemistry transport model
Welcome
For a properly functioning website: tm5.sourceforge.net
This is the TM5 website. You will find here an overview of the different model versions and of the main applications with TM5. Also you will find highlights and references to papers that use TM5. To get a flavor of scientific output of the TM5 model, see Old Pictures of the month
Picture of the Month (Fall 2023)
from
This paper looks at transport of biomass burning pollution in the remote Southern Hemisphere. Uses TM4-ECPL.
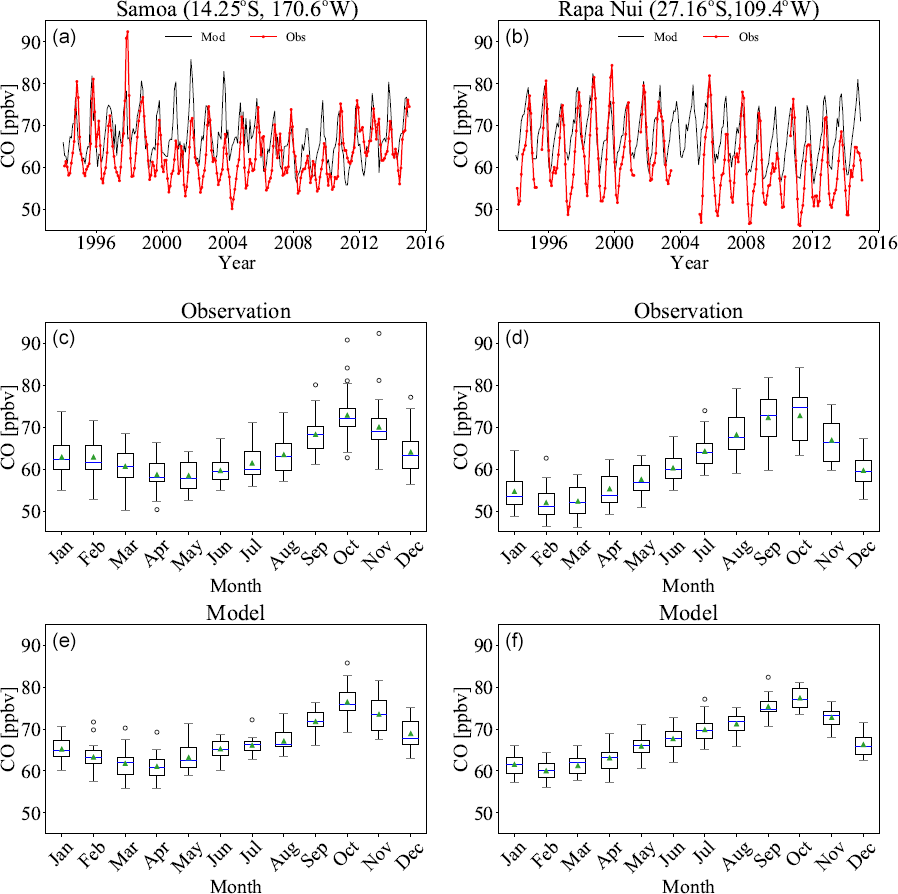
Figure 8: Time series (a, b) of observed (red line) and simulated (blue line) CO volume mixing ratios for Samoa (left) and Rapa Nui (right). The seasonal variability is depicted in box plots as shown by observations (c, d) and the simulation (e, f) for CO for the same stations. Boxes show the 25th to 75th percentiles of the data. Whiskers show the 0th and 100th percentiles, excluding outliers. Circles show outliers, the green triangle is the average, and the blue line is the median of each monthly distribution.

© Maarten Krol 2023